What is a sample chart of accounts for SaaS companies?
Table of contents
We’ve helped SaaS companies (and other startups) raise billions of dollars in venture capital funding and grow to hundreds of millions of dollars in revenue - and having clean, accrual-based financial statements is a critical part of VC due diligence and running a metric driven organization. The goal of the Chart of Accounts is to make recording financial transactions, such as revenue, expenses, investments, etc. as fool-proof and logical as possible.
This template SaaS Chart of Accounts should help you organize your financial statements, and we suggest setting it up from the get-go. While it is possible to add to or update a Chart of Accounts as you build your company, it can become pretty expensive and time consuming if you make changes after you’ve collected a lot of revenue or spend a lot developing a product.
We are including an example of a typical SaaS business’ Income Statement, and then have a standard Chart of Accounts structure, and then a table with an example Chart of Accounts for a SaaS company below. Hopefully this is helpful! And if you are looking for an experienced SaaS accountant, reach out to us.
Sample SaaS Income Statement
| Jan 2021 | Feb 2021 | Mar 2021 | |
|---|---|---|---|
| Income | |||
| 400000 Revenue | |||
| 401000 Subscription | $ 17,708 | $ 26,875 | $ 37,188 |
| Total 400000 Revenue | $ 17,708 | $ 26,875 | $ 37,188 |
| Total Income | $ 17,708 | $ 26,875 | $ 37,188 |
| Gross Profit | $ 17,708 | $ 26,875 | $ 37,188 |
| Expenses | |||
| 600000 Sales, General, and Administrative Expenses | |||
| 604000 Professional Fees | |||
| 604400 Contractors & Consultants | $ 13,197 | $ 18,954 | $ 28,493 |
| 604200 Accounting | $ 450 | $ 450 | $ 500 |
| 604100 Legal | $ 100 | $ 250 | $ 250 |
| Total 604000 Professional Fees | $ 13,747 | $ 19,654 | $ 29,243 |
| 602000 Payroll Expense | |||
| 602001 Wages | $ 16,617 | $ 20,771 | $ 41,542 |
| 602007 Payroll Processing Fees | $ 2,243 | $ 2,804 | $ 5,607 |
| 602004 Payroll Taxes | $ 1,334 | $ 1,667 | $ 3,335 |
| 602006 Workers’ Compensation | $ 15 | $ 20 | $ 38 |
| Total 602000 Payroll Expense | $ 20,209 | $ 25,262 | $ 50,521 |
| 603000 Software & Web Services | $ 1,824 | $ 2,502 | $ 3,153 |
| 601000 Sales & Marketing | |||
| 601001 Paid Ads | $ 3,790 | $ 4,316 | $ 9,248 |
| Total 601000 Sales & Marketing | $ 3,790 | $ 4,316 | $ 9,248 |
| 610000 Office Supplies & General Expense | $ 180 | $ 250 | $ 450 |
| 609000 Office Furniture / Equipment | $ 101 | $ 204 | $ 252 |
| 613000 Bank Charges | $ 47 | $ 105 | $ 118 |
| 616000 Postage & Shipping | $ 0 | $ 1 | $ 1 |
| Total 600000 Sales, General, and Administrative Expenses | $ 39,898 | $ 52,294 | $ 92,985 |
| Total Expenses | $ 39,898 | $ 52,294 | $ 92,985 |
| Net Operating Income | $ (22,190) | $ (25,419) | $ (55,797) |
| Net Income | $ (22,190) | $ (25,419) | $ (55,797) |
High Level SaaS Chart of Accounts Map
This is the highest level map of how the accounting groups will be organized. All other accounts will be sub accounts based off of this list. The numbers will help you quickly identify where any particular child is grouped - i.e. 301000 is Common Stock, which is grouped under the 300000 Equity group.
| Numbering System | Account Type |
|---|---|
| Number Grouping | Classification |
| 100000 | Asset |
| 200000 | Liability |
| 300000 | Equity |
| 400000 | Revenue |
| 500000 | COGS |
| 600000 | Sales, General & Administrative Expense |
| 700000 | Research & Development Expense |
| 900000 | Other (Income) / Expenses |
Accounts that a SaaS startup might use
In a SaaS startup’s chart of accounts, various categories of accounts are essential These typically include revenue accounts, such as subscription fees and one-time sales, which reflect the income generated from providing the service. Operating expenses accounts cover day-to-day costs like salaries, marketing expenses, and software development. Other crucial categories encompass assets, liabilities, and equity accounts, detailing the company’s financial position. Asset accounts may include cash, accounts receivable, and equipment, while liabilities might involve accounts payable and accrued expenses. Equity accounts represent the owners’ stake in the business. Each account serves a distinct purpose in tracking financial transactions and facilitating strategic decision-making for the startup.
The table below shows some different types of accounts a SaaS startup could use, along with some examples of standard account types to illustrate how the accounts are structured. The account numbers follow Kruze’s standard numbering system, but individual account numbers could vary. NOTE: This is not a comprehensive list – this is just a sample of the accounts your SasS company may require.
| Account Number | Account Name | Account Type | Detail Type |
|---|---|---|---|
| 104000 | Cash | Current Assets | Checking |
| 120000 | Accounts Receivable | Current Assets | Accounts Receivable |
| 131100 | Prepaid Expenses | Current Assets | Prepaid Expense |
| 152000 | Computers | Current Assets | Computer Equipment |
| 159000 | Accumulated Depreciation | Current Assets | Accumulated Depreciation |
| 210000 | Accounts Payable | Liabilities | Accounts Payable |
| 220000 | Credit Card | Liabilities | Credit Card |
| 300000 | Equity | Equity | Equity |
| 401000 | Subscription Revenue | Sales | Subscription Revenue |
| 402000 | Implementation Fees Revenue | Sales | Service/Consulting Income |
| 403000 | Professional Services Revenue | Sales | Service/Consulting Income |
| 500000 | Cost of Goods Sold | Cost of Goods Sold | Cost of Goods Sold |
| 502002 | Electrical | Cost of Goods Sold | Utilities |
| 505000 | Hosting Fees | Cost of Goods Sold | Other Costs of Services |
| 601000 | Marketing and Advertising Expenses | SG&A Expense | Marketing |
| 602000 | Payroll Expenses | SG&A Expense | Payroll |
| 602104 | Payroll Taxes Payable | SG&A Expense | Payroll Taxes Payable |
| 614000 | Rent Expenses | SG&A Expense | Rent |
| 700000 | Research and Development Expenses | R&D Expense | Research & Development |
| 810000 | Depreciation Expense | Other Operating Expenses | Depreciation |
| 236100 | Sales Tax Payable | LIabilities | Sales Tax Payable |
For a company providing software as a service, there may be unique accounts specific to its operations that are not typically found in a standard chart of accounts. Here are some potential unique accounts:
- Subscription Revenue. This account would track revenue generated from subscription-based models, where customers pay recurring fees for access to the company’s software platform.
- Software Licensing Revenue. If the company sells licenses for its software to customers for perpetual use rather than on a subscription basis, it would need an account to track revenue from software licensing agreements.
- Consulting Revenue. The company may offer consulting services to customers for implementation, customization, or training related to its software platform, necessitating an account to track revenue from consulting engagements.
- Data Integration Services Revenue. If the company provides data integration services to customers, helping them connect their existing systems with the software platform, it would require an account to track revenue from these services.
- Platform Usage Fees. Customers may be charged fees based on their usage of the software platform, such as the number of transactions processed, necessitating an account to track this revenue.
- Software Development Costs. Given the continuous development and enhancement of the software platform, the company may incur expenses related to research, testing, and development efforts to improve the software’s functionality and features.
- Integration Costs. This account would capture expenses related to integrating the company’s software platform with the existing systems and processes of clients, including customization and implementation costs.
- Data Security Expenses. Given the sensitive nature of any financial data handled by the software platform, the company may incur expenses for implementing and maintaining robust data security measures, such as encryption, access controls, and security audits.
These unique accounts would provide more detailed insight into the financial aspects of the company’s operations and help in accurately tracking revenues and expenses specific to its business model.
Example SaaS Chart of Accounts Template
This is a sample Chart of Accounts that we have used with hundreds of VC backed SaaS startups.
| Account Number | Account / Subaccount Name | Parent Account # | Parent Account Name | Detail Type |
|---|---|---|---|---|
| 100000 | Current Assets | N/A | N/A | Checking |
| 101000 | Bank 1 | 100000 | Current Assets | Checking |
| 102000 | Bank 2 | 100000 | Current Assets | Checking |
| 103000 | Bank 3 | 100000 | Current Assets | Checking |
| 104000 | Bank 4 | 100000 | Current Assets | Checking |
| 105000 | Bank 5 | 100000 | Current Assets | Checking |
| 106000 | Bank 6 | 100000 | Current Assets | Checking |
| 107000 | Bank 7 | 100000 | Current Assets | Checking |
| 108000 | Bank 8 | 100000 | Current Assets | Checking |
| 109000 | Bank 9 | 100000 | Current Assets | Checking |
| 110000 | Bank 10 | 100000 | Current Assets | Checking |
| 111000 | Bill.com Money Out Clearing | 100000 | Current Assets | Checking |
| 112000 | Bill.com Money In Clearing | 100000 | Current Assets | Checking |
| 120000 | Accounts Receivable | N/A | N/A | Accounts Receivable (A/R) |
| 130000 | Other Current Assets | N/A | N/A | Other Current Assets |
| 131000 | Prepaids | 130000 | Other Current Assets | Prepaid Expenses |
| 131100 | Prepaid Expenses | 131000 | Other Current Assets | Prepaid Expenses |
| 131200 | Prepaid Rent | 131000 | Other Current Assets | Prepaid Expenses |
| 131300 | Prepaid Benefits | 131000 | Other Current Assets | Prepaid Expenses |
| 132000 | Payroll Receivable | 130000 | Other Current Assets | Other Current Assets |
| 133000 | Clearing Account | 130000 | Other Current Assets | Other Current Assets |
| 133100 | Stripe Clearing | 133000 | Clearing Account | Other Current Assets |
| 133200 | Paypal Clearing | 133000 | Clearing Account | Other Current Assets |
| 133300 | Other Clearing | 133000 | Clearing Account | Other Current Assets |
| 134000 | Deferred Cost of Revenue | 130000 | Other Current Assets | Other Current Assets |
| 135000 | Deferred Refunds | 130000 | Other Current Assets | Other Current Assets |
| 136000 | Accrued Revenue | 130000 | Other Current Assets | Other Current Assets |
| 137000 | Loan to Shareholder | 130000 | Other Current Assets | Other Current Assets |
| 138000 | Undeposited Funds | 130000 | Other Current Assets | Other Current Assets |
| 150000 | Fixed Assets | N/A | N/A | Depletable Assets |
| 151000 | Furniture & Fixtures | 150000 | Fixed Assets | Fixed Asset Furniture |
| 152000 | Computers | 150000 | Fixed Assets | Fixed Asset Computers |
| 153000 | Office Equipment | 150000 | Fixed Assets | Fixed Asset Copiers |
| 154000 | Machinery & Equipment | 150000 | Fixed Assets | Machinery & Equipment |
| 155000 | Autos & Trucks | 150000 | Fixed Assets | Vehicles |
| 156000 | Building | 150000 | Fixed Assets | Buildings |
| 157000 | Land | 150000 | Fixed Assets | Land |
| 158000 | Leasehold Improvements | 150000 | Fixed Assets | Leasehold Improvements |
| 159000 | Accumulated Depreciation | 150000 | Fixed Assets | Accumulated Depreciation |
| 160000 | Intangible Assets | N/A | N/A | Intangible Assets |
| 161000 | Domain | 160000 | Intangible Assets | Intangible Assets |
| 162000 | Trademarks | 160000 | Intangible Assets | Intangible Assets |
| 163000 | Patents | 160000 | Intangible Assets | Intangible Assets |
| 164000 | Intangible Asset 1 | 160000 | Intangible Assets | Intangible Assets |
| 165000 | Intangible Asset 2 | 160000 | Intangible Assets | Intangible Assets |
| 169000 | Accumulated Amortization | 160000 | Intangible Assets | Accumulated Amortization |
| 170000 | Other Assets | N/A | N/A | Other Long-term Assets |
| 171000 | Security Deposit | 170000 | Other Assets | Security Deposits |
| 172000 | Interest Receivable | 170000 | Other Assets | Other Long-term Assets |
| 210000 | Accounts Payable | N/A | N/A | Accounts Payable (A/P) |
| 220000 | Credit Cards | N/A | N/A | Credit Card |
| 220001 | Credit Card 1 | 220000 | Credit Cards | Credit Card |
| 220002 | Credit Card 2 | 220000 | Credit Cards | Credit Card |
| 220003 | Credit Card 3 | 220000 | Credit Cards | Credit Card |
| 220004 | Credit Card 4 | 220000 | Credit Cards | Credit Card |
| 220005 | Credit Card 5 | 220000 | Credit Cards | Credit Card |
| 220006 | Credit Card 6 | 220000 | Credit Cards | Credit Card |
| 220007 | Credit Card 7 | 220000 | Credit Cards | Credit Card |
| 220008 | Credit Card 8 | 220000 | Credit Cards | Credit Card |
| 220009 | Credit Card 9 | 220000 | Credit Cards | Credit Card |
| 220010 | Credit Card 10 | 220000 | Credit Cards | Credit Card |
| 230000 | Other Current LIabilities | N/A | N/A | Other Current Liabilities |
| 231000 | 401(k) Payable | 230000 | Other Current Liabilities | Other Current Liabilities |
| 232000 | Loan from Shareholder | 230000 | Other Current Liabilities | Other Current Liabilities |
| 233000 | Payroll Liabilities | 230000 | Other Current Liabilities | Payroll Clearing |
| 234000 | Payroll Tax Liabilities | 230000 | Other Current Liabilities | Payroll Tax Payable |
| 235000 | Accruals | 230000 | Other Current Liabilities | Other Current Liabilities |
| 235100 | Accrued Expenses | 235000 | Other Current Liabilities | Other Current Liabilities |
| 235200 | Accrued Rent | 235000 | Other Current Liabilities | Other Current Liabilities |
| 235300 | Accrued Vacation | 235000 | Other Current Liabilities | Other Current Liabilities |
| 236000 | Taxes Payable | 230000 | Other Current Liabilities | Other Current Liabilities |
| 236100 | Sales Tax Payable | 236000 | Other Current Liabilities | Other Current Liabilities |
| 236200 | Use Tax Payable | 236000 | Other Current Liabilities | Other Current Liabilities |
| 236300 | SF Tax Payable | 236000 | Other Current Liabilities | Other Current Liabilities |
| 237000 | Deferred Revenue | 230000 | Other Current Liabilities | Other Current Liabilities |
| 238000 | Sublease Deposit & Prepaid Rent | 230000 | Other Current Liabilities | Other Current Liabilities |
| 239000 | Employee Reimbursement Liability | 230000 | Other Current Liabilities | Other Current Liabilities |
| 240000 | Long Term Liabilities | N/A | N/A | Other Long Term Liabilities |
| 241000 | Notes / Bonds Payable | 240000 | Long Term Liabilities | Notes Payable |
| 242000 | Accrued Interest | 240000 | Long Term Liabilities | Notes Payable |
| 300000 | Equity | N/A | N/A | Preferred Stock |
| 301000 | Common Stock | 300000 | Equity | Common Stock |
| 302000 | SAFE Notes | 300000 | Long Term Liabilities | Preferred Stock |
| 302001 | SAFE Investor 1 | 302000 | SAFE Notes | Preferred Stock |
| 302002 | SAFE Investor 2 | 302000 | SAFE Notes | Preferred Stock |
| 302003 | SAFE Investor 3 | 302000 | SAFE Notes | Preferred Stock |
| 302004 | SAFE Investor 4 | 302000 | SAFE Notes | Preferred Stock |
| 302005 | SAFE Investor 5 | 302000 | SAFE Notes | Preferred Stock |
| 302006 | SAFE Investor 6 | 302000 | SAFE Notes | Preferred Stock |
| 302007 | SAFE Investor 7 | 302000 | SAFE Notes | Preferred Stock |
| 302008 | SAFE Investor 8 | 302000 | SAFE Notes | Preferred Stock |
| 302009 | SAFE Investor 9 | 302000 | SAFE Notes | Preferred Stock |
| 303000 | Preferred Stock | 300000 | Equity | Preferred Stock |
| 303100 | Series Seed | 303000 | Preferred Stock | Preferred Stock |
| 303200 | Series A | 303000 | Preferred Stock | Preferred Stock |
| 303300 | Series B | 303000 | Preferred Stock | Preferred Stock |
| 303400 | Series C | 303000 | Preferred Stock | Preferred Stock |
| 303900 | Financing Costs | 303000 | Preferred Stock | Accumulated Adjustment |
| 304000 | Paid-In Capital | 300000 | Equity | Paid-In Capital or Surplus |
| 305000 | Treasury Stock | 300000 | Equity | Treasury Stock |
| 308000 | Opening Balance Equity | 300000 | Equity | Opening Balance Equity |
| 400000 | Sales | N/A | N/A | Sales of Product Income |
| 401000 | Product SKU 1 | 400000 | Sales | Sales of Product Income |
| 402000 | Product SKU 2 | 400000 | Sales | Sales of Product Income |
| 403000 | Product SKU 3 | 400000 | Sales | Sales of Product Income |
| 404000 | Discounts | 400000 | Sales | Discounts/Refunds Given |
| 405000 | Refunds | 400000 | Sales | Discounts/Refunds Given |
| 500000 | Cost of Goods Sold | N/A | N/A | Other Costs of Services - COS |
| 501000 | Direct Labor | 500000 | Cost of Goods Sold | Cost of Labor - COS |
| 504000 | Overhead Allocation | 500000 | Cost of Goods Sold | Other Costs of Services - COS |
| 505000 | Hosting Fees | 500000 | Cost of Goods Sold | Other Costs of Services - COS |
| 600000 | Sales, General, and Administrative Expenses | N/A | N/A | Advertising/Promotional |
| 601000 | Sales & Marketing | 600000 | Sales, General, and Administrative Expenses | Advertising/Promotional |
| 601001 | Paid Ads | 601000 | Sales & Marketing | Advertising/Promotional |
| 601002 | Promotional Items | 601000 | Sales & Marketing | Advertising/Promotional |
| 601003 | Conferences | 601000 | Sales & Marketing | Advertising/Promotional |
| 601004 | Sales Commission | 601000 | Sales & Marketing | Advertising/Promotional |
| 602000 | Payroll Expense | 600000 | Sales, General, and Administrative Expenses | Advertising/Promotional |
| 602001 | Wages | 602000 | Payroll Expense | Payroll Expenses |
| 602002 | Bonuses | 602000 | Payroll Expense | Payroll Expenses |
| 602003 | Vacation Expense | 602000 | Payroll Expense | Payroll Expenses |
| 602004 | Payroll Taxes | 602000 | Payroll Expense | Payroll Expenses |
| 602005 | Employee Benefits | 602000 | Payroll Expense | Payroll Expenses |
| 602006 | Workers’ Compensation | 602000 | Payroll Expense | Payroll Expenses |
| 602007 | Payroll Processing Fees | 602000 | Payroll Expense | Payroll Expenses |
| 603000 | Software & Web Services | 600000 | Sales, General, and Administrative Expenses | Office/General Administrative Expenses |
| 604000 | Professional Fees | 600000 | Sales, General, and Administrative Expenses | Legal & Professional Fees |
| 604001 | Legal | 604000 | Professional Fees | Legal & Professional Fees |
| 604002 | Accounting | 604000 | Professional Fees | Legal & Professional Fees |
| 604003 | Recruiting | 604000 | Professional Fees | Legal & Professional Fees |
| 604004 | Contractors & Consultants | 604000 | Professional Fees | Legal & Professional Fees |
| 605000 | Travel Expenses | 600000 | Sales, General, and Administrative Expenses | Travel |
| 606000 | Meals | 600000 | Sales, General, and Administrative Expenses | Travel |
| 607000 | Entertainment / Team Events | 600000 | Sales, General, and Administrative Expenses | Other Business Expenses |
| 608000 | Insurance Expense | 600000 | Sales, General, and Administrative Expenses | Insurance |
| 609000 | Office Furniture / Equipment | 600000 | Sales, General, and Administrative Expenses | Office/General Administrative Expenses |
| 610000 | Office Supplies | 600000 | Sales, General, and Administrative Expenses | Office/General Administrative Expenses |
| 611000 | Telephone / Internet Expense | 600000 | Sales, General, and Administrative Expenses | Office/General Administrative Expenses |
| 612000 | Utilities Expense | 600000 | Sales, General, and Administrative Expenses | Office/General Administrative Expenses |
| 613000 | Bank Charges | 600000 | Sales, General, and Administrative Expenses | Bank Charges |
| 614000 | Rent Expense | 600000 | Sales, General, and Administrative Expenses | Rent or Lease of Buildings |
| 700000 | Research & Development Expenses | N/A | N/A | Other Business Expenses |
| 900000 | Other (Income) / Expenses | N/A | N/A | Other Miscellaneous Expense |
| 901000 | Interest (Income) / Expense | 900000 | Other (Income) / Expenses | Other Miscellaneous Expense |
| 902000 | Taxes & Licenses | 900000 | Other (Income) / Expenses | Other Miscellaneous Expense |
| 903000 | Depreciation Expense | 900000 | Other (Income) / Expenses | Depreciation |
| 904000 | Amortization Expense | 900000 | Other (Income) / Expenses | Amortization |
| 905000 | Bad Debt Expense | 900000 | Other (Income) / Expenses | Other Miscellaneous Expense |
SaaS Company Chart of Accounts FAQ
What is a Chart of Accounts?
A Chart of Accounts is a legend/index/map of all of the “accounts” where financial transactions can be recorded in your company’s general ledger and accounting system. Each possible location, i.e. account, where a transaction can be listed is recorded in the Chart of Accounts.
Why does a Chart of Accounts matter?
A well designed Chart of Accounts should make it easy to know where to record a company’s transactions. Correctly recorded transactions help business owners and startup founders get better understanding into their company’s performance, and makes following GAAP and accounting standards much, much easier.
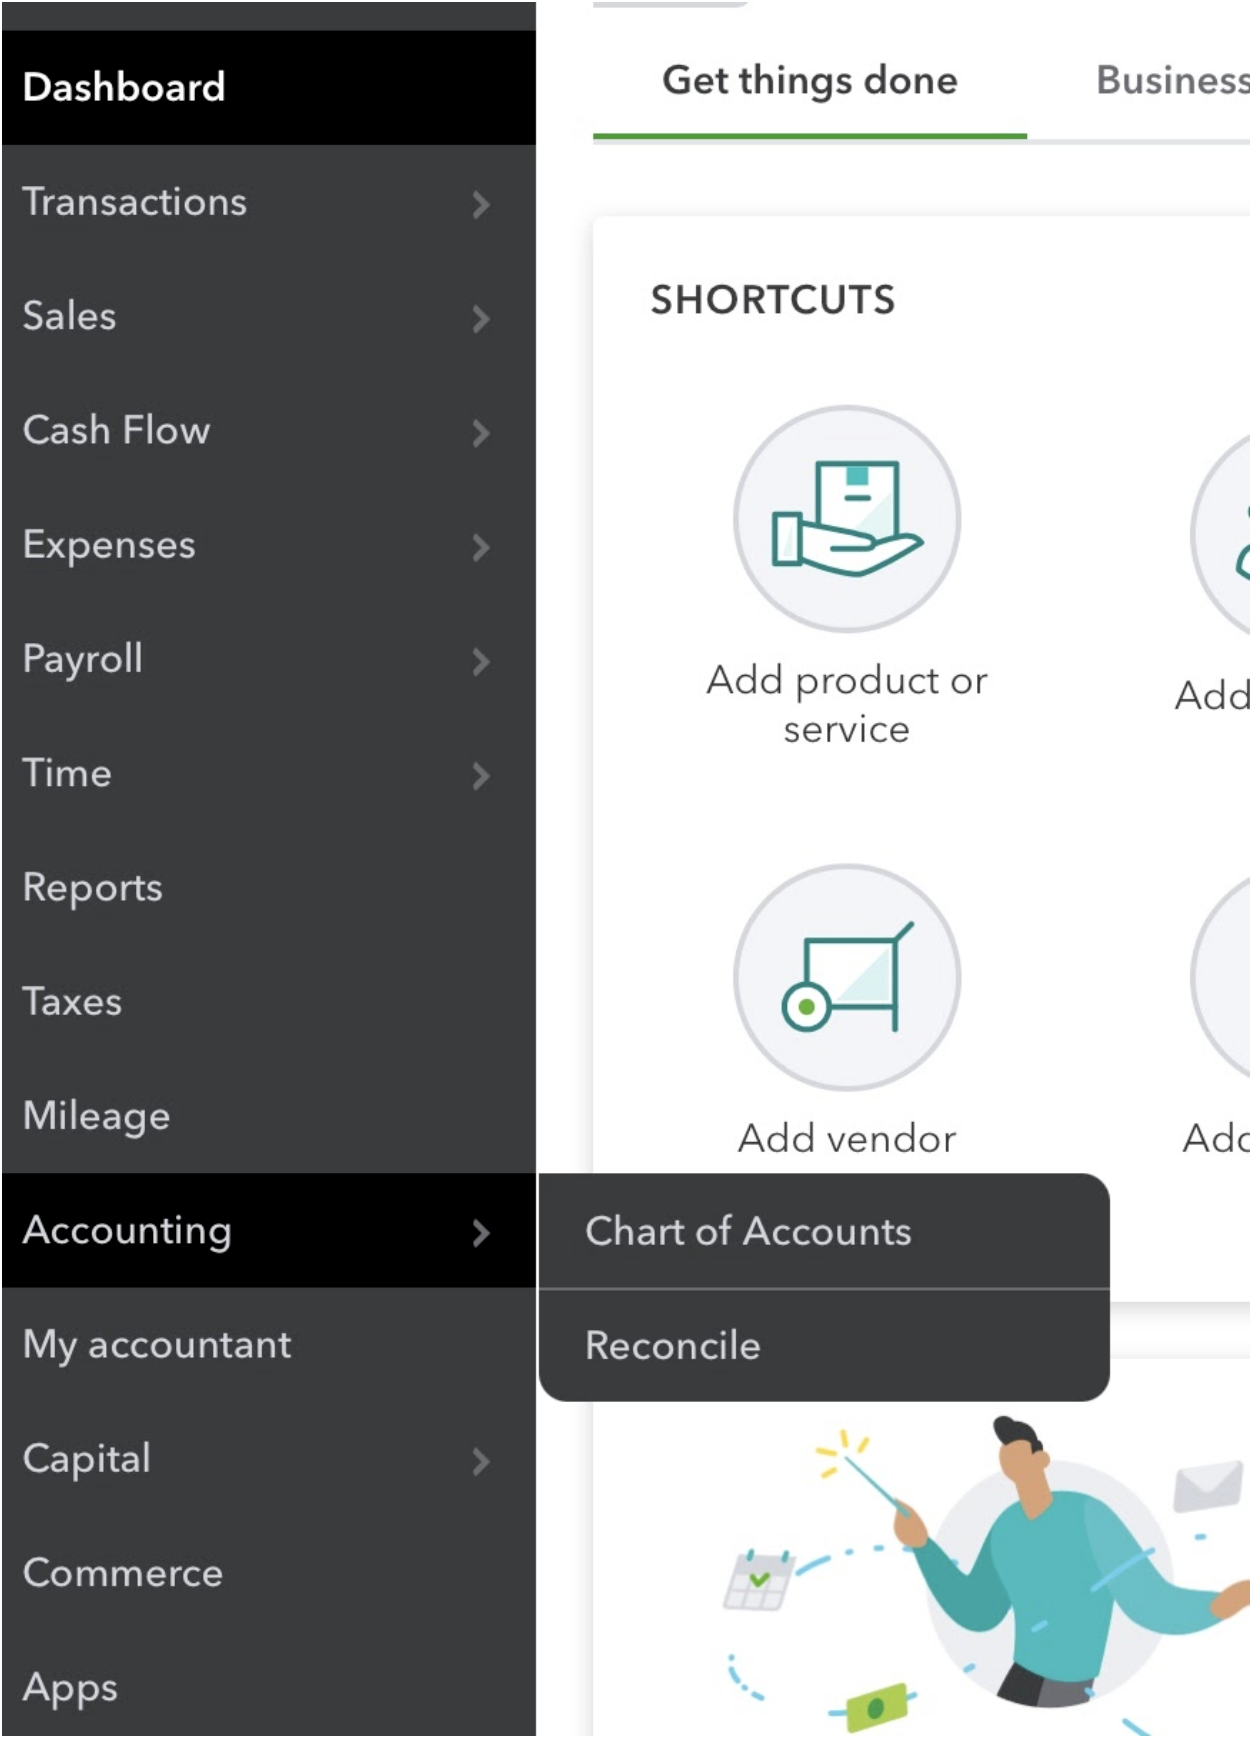
Where can you access your company’s Chart of Accounts?
QuickBooks Online is the defacto standard accounting software for venture capital backed startups in the United States, and you find your Chart of Accounts in QuickBooks by hovering over “Accounting” in the navigation column on the left, then clicking “Chart of Accounts.”
Can you change your startup’s Chart of Accounts?
Yes, the COA is not set in stone! If you are using a modern accounting software, it is not too hard to add to your chart of accounts. However, adding in a new item to the chart can make you have to do some extra work. For example, you may have to go back and recategorize transactions that now fit into the new item - although you probably should not change closed tax periods.
Major changes to the COA are also possible, but can be quite a bit of work. We’d recommend working with an experienced startup accountant (like Kruze) if you are going to make serious changes. Additionally, making changes to prior years is not a good idea - those books should be closed when you file your taxes.
What is special about a SaaS company’s Chart of Accounts?
A financial analyst should be able to guess the industry your company is in by looking at your Chart of Accounts - and SaaS businesses are no exception. SaaS businesses are more likely than the average business to have Deferred Revenue, Accrued Revenue and Deferred Costs of Revenue on the balance sheet. SaaS businesses are less likely to have Inventory on the Balance Sheet, and are also less likely to need Direct Parts & Materials, Electrical and Freight & Delivery/Shipping on the Income Statement. This hints at part of the reason why investors love SaaS companies so much - those accounts correspond to cash-intensive activities, while traditional SaaS businesses are generally asset light and have easy to deliver software services!
Where should a SaaS company book non-recurring revenue?
Not all revenue will be recurring. VC’s like to know what recurring revenue is to calculate ARR - so it’s helpful to break it out into a separate account number in your SaaS company chart of accounts. In the template above, we’d suggest using number 401000 for recurring revenue and 402000 for non-recurring revenue.
Examples of non-recurring revenue - all of which could have their own account number in the COA - might be implementation revenue, overage charges, custom development work, one time access charges, one time support fees and more.
How does Deferred Revenue work at a SaaS company?
One of the most important elements of a SaaS company’s financial statements and Chart of Accounts is the interplay between Deferred Revenue, Cash and Recognized Revenue. MRR is generally calculated as the monthly recognized revenue (although different VCs do look at MRR differently; MRR is not an accounting defined term, so the actual definition can vary based on the business!) So how Deferred Revenue converts into Recognized Revenue matters quite a bit.
When a SaaS company is paid up front for a service that will be delivered over time (often over 12 months with standard SaaS company contracts), the company can not recognize all of that revenue at once. Instead, it recognizes the revenue over the 12 month period. The cash that is received goes onto the balance sheet, and the offsetting liability is Deferred Revenue. Each month, typically ratably, the Recognized Revenue goes onto the Income Statement, and the liability account of Deferred Revenue decreases. You can read more about deferred revenue on our financial modeling template page, as projecting and modeling deferred revenue can be tricky.
Categories:
Startup AccountingTable of contents
READY TO CONNECT FOR A FREE CONSULTATION?
We are the experts at helping seed/VC-backed Delaware C-Corps with their accounting and finances!
Talk to an experienced accountant, not a generic sales person


$250M+ VC Funding Raised
"I had a great experience working with Kruze Consulting when we raised Series A. They know what VCs need to see, and how to present a startup's books and finances. If you are going to raise venture capital, you need experts like Kruze."
Chris Mansi
CEO
Startup Venture Capital Assistance
With former venture capitalists on staff, our team is here to help you navigate the fundraising process and manage your board of directors

Founder & CEO, CPA
Scale Remote Operations & Team
"Kruze has supported us above and beyond basic accounting needs by ensuring we have everything we need to expand and support our team wherever they may be located"
Zack Fisch
Head of Operations & Legal
Clients who have worked with Kruze have collectively raised over $15 billion in VC funding.
We set startups up for fundrising success, and know how to work with the top VCs.
Founder & CEO
Experienced team helping you
Our account management team is staffed by CPAs and accountants who have, on average, 11 years of experience.

VP of Accounting Services

Controller

SUT/R&D Sr. Tax Accountant

Controller, CPA

Grew from a 2-person startup to a NASDAQ listed public company.
"The Kruze team helped us grow from a 2-person startup to a NASDAQ listed public company in 2 years. We wouldn't have gotten public without Kruze's support. Anyone thinking of launching a startup should make Vanessa their first call!"
Jesse Shefferman
CEO
Recent questions
- Are You Missing Hidden Tax Deductions Because Your Bookkeeping Isn’t Up-to-Date or Detailed Enough?
- How Does Modern Bookkeeping Automation Improve Cash Flow Visibility and Support Smarter Business Decisions?
- What Bookkeeping Strategies Can Help a Fast-Growing Startup Maintain Accurate Financials Without Slowing Down Innovation?
- What Is Net Working Capital in M&A, and Why Does It Matter for Deal Value?
- How Can Startups Identify and Track Sales Tax Nexus Across Multiple States to Ensure Full Compliance?
Top viewed questions
- What happens if the IRS audits me and I do not have the receipt for an expense (assuming it was a legitimate expense)?
- How should convertible note financing be handled on the balance sheet?
- How do startups account for equity and fundraising on the Balance Sheet?
- For startups incorporating in Delaware, what firms are good registered agents to use?
- 2025 Founder Salaries by Stage