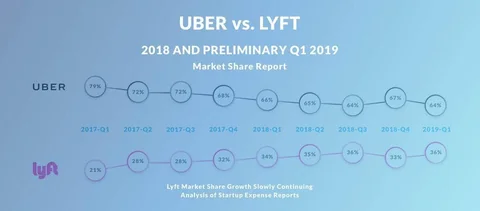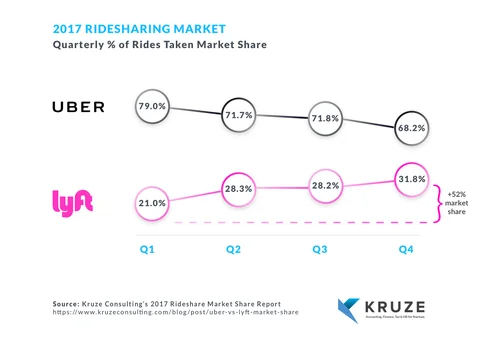
| # | Uber market share | Lyft market share |
|---|---|---|
| 2017 Q1 | 79 | 21 |
| 2017 Q2 | 72 | 28 |
| 2017 Q3 | 72 | 28 |
| 2017 Q4 | 68 | 32 |
| 2018 Q1 | 66 | 34 |
| 2018 Q2 | 65 | 35 |
| 2018 Q3 | 64 | 36 |
| 2018 Q4 | 67 | 33 |
| 2019 Q1 | 64 | 36 |
An Updated Look At The Ridesharing Choices Made By Today’s Preeminent Startups.
As of the first quarter of 2019, Lyft is still slowly gaining market share, and Q4 2018 to Q1 2019 rideshare revenue growth was surprisingly weak.
Last year, we published an analysis of ridesharing transactions, as measured through startups’ expense reports (that previous report is still available on this page, below). An updated view, with preliminary Q1 2019 numbers, shows that Lyft is still slowly gaining market share over Uber - but not as quickly as 2017. Our preliminary numbers show Lyft with 36% of the market in Q1 2019, vs. Uber’s 64% (as a percent of the rides; read more about how this is calculated below).
Our analysis now includes over 120,000 ridesharing transactions expensed by over 170 seed and venture-backed startups. This is a view into how high tech employees make ridesharing decisions, and in this particular analysis the vast majority of the companies are located in the greater SF/Silicon Valley area.
What happened with Uber / Lyft market share in Q4 2018?
We were a little surprised to see that the trend for the fourth quarter of 2018 did not follow the pattern of Lyft winning greater and greater share. In fact, in Q4 2018, Uber took back some of Lyft’s hard won gains and increased its market share over Lyft. We can only speculate as to why this happened - but if you allow us to speculate, then we might think this is due to Uber finding ways to discount / bring down the cost of a ride. The rough cost per ride for the two companies is below:
| Average Quarterly Cost Per Ride | 2017 Q4 | 2018 Q4 | 2019 Q1 |
|---|---|---|---|
| Lyft | $21.00 | $28.10 | $23.00 |
| Uber | $19.40 | $20.40 | $20.40 |
Lyft increased its average revenue per ride by one third during 2018, while Uber’s held almost steady. This may be due to aggressive discounting and other forms of price reduction (like pools, etc.). Again, this is only speculation. There are many other factors that could influence the average cost per ride in any quarter, such as surge pricing, length of the rides, etc. - and we can not capture these variables in our analysis.
The Q1 2019 ride share market
Our preliminary data suggests that the startups did not dramatically increase their spending on ride sharing in the 1st quarter of 2019. Our data for the first quarter is not fully complete, as many expense reports have yet to be submitted. While we do not think that this will dramatically change the preliminary number that we are currently sharing, we did want to disclose that the numbers are not yet finalized. Assuming a reasonable range of missing data, the Q1 ride sharing market was either flat to up around 12% vs Q4 2018. This is surprisingly weak quarter over quarter growth.
What is Uber and Lyft’s market share in Q1 2019?
Lyft regained share in the first quarter of 2019, increasing their share by almost 9% (an additional 3% of the overall ride sharing market). This puts Lyft at 36% of number of rides expensed for Q1, and Uber’s market share at 64%.
A note on the Ridesharing Market Chart. This chart is an average of averages - each startup’s Uber and Lyft ride volume is calculated as a percentage for the quarter, then the average is taken for all of the companies to calculate the quarterly average shown. We did this to reduce the impact of large clients on the analysis. About one of Kruze’s clients is acquired each month (we know a lot about getting the books ready for an exit). We wanted to avoid a couple large clients coming in or out of the analysis, thus making it harder to do an apples to apples, quarter over quarter comparison; which is why we averaged the market share for each company then took an average of all of these averages. This analysis is done by analyzing the expense reports of funded startups, and mainly represents SF/Silicon Valley companies. It is not intended to represent the overall US consumer ridesharing market, although to the extent that startup employees are early adopters of technology trends, may be an interesting data point.
We have included our previous, 2017 ride sharing market share analysis, below for your reference. This was originally published in May of 2018 and analyzed Uber and Lyft’s market share for the calendar year 2017.
2017 Ride Sharing Market Share Analysis.
The content below was originally published in May of 2018, and covered Uber and Lyft’s market share for the calendar year 2017. We have kept this data here for your reference.
At Kruze Consulting, we help hundreds of early stage, venture-backed startups with their bookkeeping and taxes. This gives us a unique view into trends shaping the startup community– including what companies spend money on, the service providers they rely on, and how they allocate their spending based on current events. Our CEOs regularly ask us to benchmark their expenses, venture debt and more.
Uber vs. Lyft
The decisions made by companies and their employees to spend corporate money on Uber and Lyft has been a hot conversation in many circles – even more so in the last year or so. After all, 2017 was a turbulent time in the ridesharing space. So, we decided to run an analysis to see how funded companies and their employees reacted to the controversies.
What do the numbers tell us?
In summary: Lyft took real market share.
We analyzed over 40,000 ridesharing transactions expensed by over 140 venture-backed startups, and found that Lyft increased market share by 50% in 2017. Our data shows that Lyft substantially increased market share in 2017, especially over March and April. Our market share analysis of Uber vs. Lyft, as analyzed through the lens of how many of their employees’ rides startups are paying for, shows that the frequency of Uber rides took a significant hit in March, that accelerated into April of 2017. Lyft then maintained this market share through the summer - until the fourth quarter. In October and November, Lyft usage began to meaningfully outpace Uber, gaining more unit volume market share.

In addition to analyzing the number of rides taken, we also studied the money spent on Uber and Lyft rides on a quarterly basis. This data helped us understand how the overall ridesharing market was growing each quarter, and which company was achieving higher quarter over quarter growth. For all but two months of the year, Kruze clients increased spend on ridesharing. The exceptions were December 2017, which makes sense as less business is conducted over the holidays**, and April 2017, when the reduction in Uber rides was so great as to reduce the overall category spend. Lyft enjoyed superior revenue growth in every quarter that we compared.
How much does the average startup spend on Uber and Lyft?
Ridesharing is a significant cost for many startups. The average company in our dataset spent approximately $5,500 per year on ridesharing! While startups may spend more overall as they grow, they tend to spend less money on Uber and Lyft on a per employee basis.
Why would startups’ per employee ridesharing expenses decrease as companies increase in size? From our interactions with startup CEOs, we think this is likely due to two main factors. As companies get bigger, they get better at controlling their expenses. Additionally, once companies hire fewer non-founders, they tend to have a smaller percentage of the overall employee base traveling to drive partnerships/make sales/interview potential clients.
Reporters looking for breakout data/images for news stories should contact WeLoveStartups@kruzeconsulting.com, as we have created individual images for stories and have deeper data available.
Still haven’t filed your taxes?
Kruze Consulting wants to remind startup founders that it’s tax time - even pre-revenue startups need to file taxes! Visit KruzeTax.com to get a speedy, low-cost tax return from Kruze, an accounting firm 100% focused on seed and venture-funded startups.
Disclosures
A note on the “2017 Ridesharing Market” chart is an average of averages - each startup’s Uber and Lyft ride volume is calculated as a percentage for the quarter, then the average is taken for all of the companies to calculate the quarterly average shown. We did this to reduce the impact of large clients on the analysis. About one of Kruze’s clients is acquired each month (we know a lot about getting the books ready for an exit). We wanted to avoid a couple large clients coming in or out of the analysis, thus making it harder to do an apples to apples, quarter over quarter comparison; which is why we averaged the market share for each company then took an average of all of these averages. To reduce the possibility of data bias, the “Quarterly Percentage Change $ Spent” analysis was conducted using a matched pair analysis. Only companies with spend in each quarter analyzed were included.
Our data is only for rideshares paid for by startups (i.e. business expenses). Naturally, business spending should decrease in over the December holidays. We don’t make any claim that this is what happened to the ridesharing market overall in December, as consumer spending may be very different over the holiday period.


